
This is the second post in the fcnMode series. The first part can be viewed from the following link: File Change Notification (fcnMode): What is it and how does it affect my Sitecore Application. This blog post will serve as a comprehensive guide for obtaining the fcnMode (File Change Notification) value from Memory Dumps.
In some cases, you may need to verify the actual value of fcnMode that has been set, and using memory dumps is the only way to do so. This process is complex yet critically important, and information about it is scarce on the web.

The steps to retrieve the fcnMode value from memory dumps are as follows:
1. Download WinDbg:
Download the WinDbg software from the following link: Install the Windows debugger.
The most straightforward installation method is to download the WinDbg Packet Installer and follow the instructions displayed on the screen.
2. IISReset and Browse the Site:
Open Command Prompt as Administrator and execute the iisreset command.
After the command has finished executing, browse the website.

3. Downloading the User Dumps:
- Open Internet Information Services (IIS) -> Click on the Server Name -> Click on Worker Processes -> Note down the Process ID of the App Pool for your website.

- Go to Task Manager -> Details -> Locate the w3wp.exe process with the PID noted in the previous step -> Right-click on it -> Choose “Create dump file.”
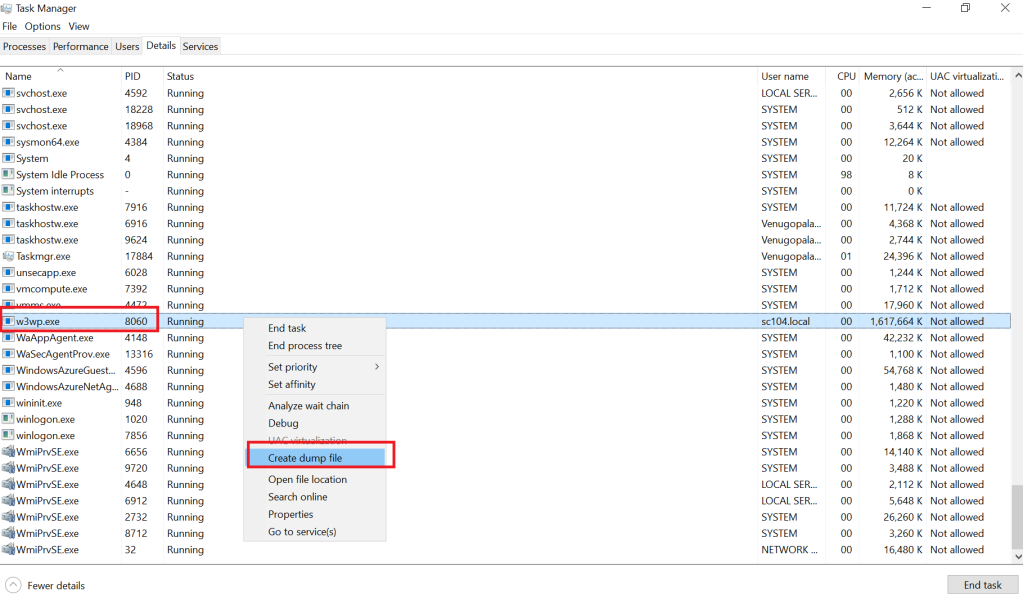
- Note down the location where the dump file has been created. This is typically in the following directory:
\AppData\Local\Temp\2\w3wp.dmp.
4. Attaching the .dbg file in WinDbg:
Open the WinDbg application in Administrator mode -> Go to File -> Open Dump File -> Navigate to and select the dump file created in Step 3. This process may take some time. Monitor the progress bar at the bottom; once it disappears, the dump file has been successfully loaded.


5. Running the commands:
Execute the following commands in the specified order. Please note these commands may take a longer time to execute and hence do not execute the next command until the *BUSY* label next to the input box disappears.


5.1. Open the Command Viewer Window:
Click on View on DebugDiag -> Click on Command
5.2. Run the analyze command:
!analyze -vThis command is essential as it would download the relevant SOS Debugging Extension files which are required to run the next dumpheap command.
Note: You need to run this command only once. After this command has been successfully executed, you may even attach different dump files and check the fcnMode values.
5.3. Run the dumpheap command to get the memory address:
!dumpheap -type System.Web.FileChangesMonitorPlease note the format for the command is listed below. It can be used to get the memory address of other classes too:
!dumpheap -type YourNamespace.YourClassThe output would be similar to the following:
         Address               MT     Size
0000018e752b7430 00007ffd36800858      104
5.4. Download and load the MEX Debugging Extension:
5.4.1. Download MEX:
Download the MEX Debugging Extension from the following link: MEX Debugging Extension for WinDbg. Double-click on the downloaded .exe file and Select a location where you want to place the extracted files (eg. C:\MEX Debugger)
5.4.2. Load the MEX Extension in the WinDBG command viewer:
Type the following command in the WinDBG command viewer:
.load C:\MEX Debugger\Mex\x64\mex.dllNote: Assuming mex.dll is stored at C:\MEX Debugger\Mex\x64
5.5. Run the MEX DisplayObj command to get the value of fcnMode:
Run the following MEX DisplayObj command with the address found in Step 5.3 (0000018e752b7430):
!mex.DisplayObj 0x0000018e752b7430The response format should resemble the following block:
0x0000018e752b7430 System.Web.FileChangesMonitor
[statics]
  0000  _aliases                           : NULL
  0008  _dirs                              : NULL
  0010  _dirMonSubdirs                     : NULL
  0018  _subDirDirMons                     : NULL
  0020  _dirMonSpecialDirs                 : NULL
  0028  _callbackRenameOrCriticaldirChange : NULL
  0030  _dirMonAppPathInternal             : NULL
  0038  _appPathInternal                   : NULL
  0040  _activeCallbackCount               : 0 (System.Int32)
  0044  _FCNMode                           : 1 (System.Int32)
  0048  _disposed                          : False (System.Boolean)
  0050  _lockDispose                       : 0000018e752b7488 (System.Web.Util.ReadWriteSpinLock)
The Integer value of _FCNMode in the above response indicates the actual set value. In this case, the integer value 1 denotes that the File Change Notification has been disabled. The next section provides details about the values from the _FCNMode attribute.
The _FCNMode Values:
The following table denotes the _FCNMode value from the dump for various scenarios:
| _FCNMode Value from Dump | Setting |
| 0 | fcnMode is not disabled |
| 1 | fcnMode is Disabled |
| 2 | fcnMode is Single |
That concludes our exploration of retrieving the fcnMode value from memory dumps. By following these steps, you can now confidently navigate memory snapshots to locate and interpret this crucial information. Stay tuned for the next posts. Until then, happy debugging!
About me:

Vivek Anandan Venugopalan
Hi! I’m a Sitecore Certified Advanced Developer from India with 8+ years of Experience working with Sitecore. I am an avid Railfan and love Cycling and Traveling. I also have a couple of travel blogs which can be checked by clicking on the first couple of links below.
